
Data Analysis Freelancing: Skills in Demand
Data analysis is one of those freelance skills that quietly powers major business decisions. Companies collect enormous amounts of data but most of them have no idea what to do with it. They have spreadsheets, databases, analytics dashboards, and CRM records overflowing with information, yet they lack the expertise to extract meaningful insights. That gap is where freelance data analysts build profitable careers.
The demand for data analysis spans every industry. Retail companies want to understand customer purchasing patterns. SaaS businesses need churn analysis and cohort reporting. Marketing teams want campaign performance breakdowns. Healthcare organizations need outcomes analysis. Financial firms want risk modeling. If a company generates data (and they all do), they need someone who can make sense of it.
What Data Analysts Do for Clients
At the most basic level, freelance data analysts take raw data and turn it into answers. A client might hand you a messy spreadsheet with 50,000 rows and ask, "Which customers are most likely to buy again?" or "Where are we losing money?" or "What should we focus on next quarter?" Your job is to clean the data, analyze it, and present clear findings that the client can act on.
Data cleaning and preparation is often the largest part of the job. Real world data is messy. It has duplicates, missing values, inconsistent formatting, and errors. Before any analysis can happen, the data needs to be organized, validated, and structured. Clients rarely understand how much work this takes, so setting expectations upfront is important.
Exploratory analysis is where you look for patterns, trends, and anomalies in the data without a specific hypothesis. You might discover that a client loses most of their customers after month three, or that a specific product category drives most of their profit, or that their website traffic spikes every Tuesday for no obvious reason. These discoveries inform strategy.
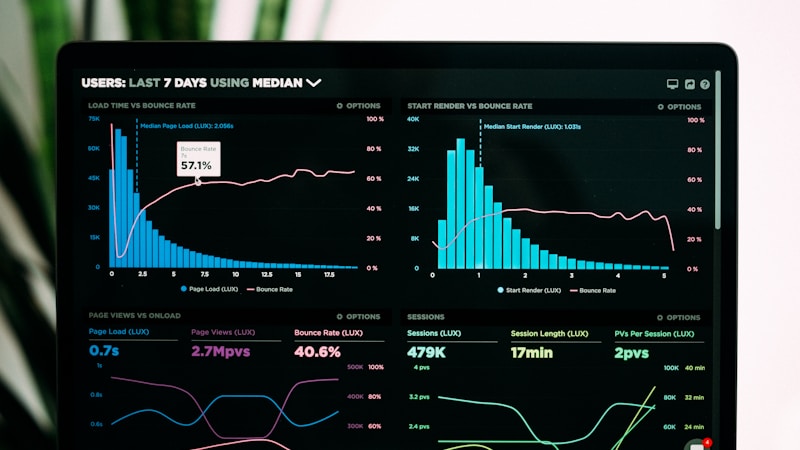
Dashboard creation and reporting translate your findings into visual formats that clients can understand and use on an ongoing basis. Building a dashboard in Google Data Studio, Tableau, or Power BI that updates automatically gives the client lasting value beyond the initial analysis.
Predictive analysis and modeling are higher-level services where you use statistical methods or machine learning to forecast outcomes. Revenue projections, demand forecasting, customer lifetime value models, and churn prediction fall into this category. These projects command premium rates because the business impact is directly measurable.
Tools Every Data Analyst Should Know
Excel and Google Sheets remain essential. Many clients work entirely in spreadsheets, and the ability to perform advanced analysis using pivot tables, VLOOKUP, array formulas, and macros is foundational. Do not underestimate the value of spreadsheet mastery just because flashier tools exist.
SQL is non-negotiable for any serious data analyst. Most business data lives in databases, and SQL is how you access it. Clients expect you to write queries that pull exactly the data you need without waiting for someone else to export it for you. PostgreSQL, MySQL, and BigQuery are the most common databases you will encounter.
Python is the dominant programming language for data analysis. Libraries like Pandas, NumPy, Matplotlib, and Scikit-learn give you the power to handle large datasets, perform complex analysis, and build predictive models. R is an alternative that is popular in academic and research-heavy contexts.
Visualization tools like Tableau, Power BI, and Looker are valuable skills that increase your project range. Clients love interactive dashboards that let them explore data themselves without needing to call you every time they have a question.
Google Analytics, Mixpanel, and Amplitude are important if you work with digital businesses. Understanding how to pull, clean, and analyze web and product analytics data is a specialty that digital companies pay well for.
Types of Data Analysis Projects
Financial analysis projects involve revenue modeling, expense analysis, profitability breakdowns, and budget forecasting. These projects are common among startups preparing for fundraising, established businesses planning their next year, and companies evaluating new market opportunities.
Marketing analytics covers campaign performance, attribution modeling, customer segmentation, and ROI analysis. Marketing teams generate vast amounts of data across multiple channels, and they need someone to synthesize it into actionable recommendations.
Operations analysis focuses on efficiency, process optimization, supply chain performance, and capacity planning. Manufacturing companies, logistics firms, and service businesses all benefit from data-driven operational improvements.
Customer analytics includes churn analysis, segmentation, lifetime value modeling, and satisfaction analysis. Every subscription business, e-commerce store, and service company wants to understand their customers better, and data analysis provides those insights.
Survey and research analysis involves cleaning and interpreting survey data, focus group results, and market research findings. Companies conduct research but often lack the statistical expertise to analyze it properly.
Pricing Data Analysis Work
Data analysis projects are best priced per project or per deliverable rather than per hour. The value of your work is in the insights and decisions it enables, not in the hours you spend cleaning spreadsheets. A churn analysis that helps a company retain thousands of customers is worth far more than the hours it took you to produce it.
For defined projects (analyze this dataset, build this dashboard, create this model), provide a fixed project price with a clear scope. Use the milestone escrow system on MyFreelancer to break larger projects into phases: data collection and cleaning, analysis, and reporting or dashboard delivery.
Ongoing analytics support works well as a retainer. A monthly retainer that includes regular reporting, ad-hoc analysis requests, and dashboard maintenance provides predictable income for you and consistent analytical support for the client.
Check the fees page to understand how MyFreelancer fees work so you can factor them into your pricing. The tiered structure benefits analysts who build retainer relationships because your effective platform costs decrease as your monthly revenue grows.
Building Your Data Analysis Portfolio
Data analysis portfolios look different from design or development portfolios. You can not simply show screenshots. You need to demonstrate your analytical thinking and your ability to communicate findings clearly.
Create portfolio projects using publicly available datasets. Kaggle, government data portals, and public APIs provide rich datasets you can analyze. Write up your findings as case studies: describe the question you investigated, the methods you used, what you found, and what actions you would recommend based on the data.
Include visualizations that demonstrate your ability to make data accessible. A beautifully crafted chart that tells a clear story is more impressive than pages of statistical output. Clients hire data analysts to get clarity, and your portfolio should prove you can deliver it.
On MyFreelancer, your profile should clearly state your analytical specialties, the tools you use, and the types of projects you handle. A verification badge adds credibility, which matters in a field where clients are trusting you with sensitive business data.
Growing Your Analytics Practice
The most successful freelance data analysts evolve from project workers to trusted advisors. Instead of waiting for clients to bring you datasets, you proactively identify what data they should be collecting and what questions they should be asking. This consultative approach commands higher rates and longer client relationships.
Specializing in an industry accelerates your growth. A data analyst who understands e-commerce metrics, SaaS benchmarks, or healthcare data regulations brings domain knowledge that generalists can not match. Clients in specialized industries prefer analysts who already speak their language.
The scoring system on MyFreelancer builds your reputation over time. Completing projects on deadline, earning positive reviews, and maintaining quality standards all improve your visibility to potential clients. A strong score combined with a verified badge signals reliability and professionalism.
Data is everywhere, and the companies that use it well outperform those that do not. If you have the analytical skills and the ability to communicate insights clearly, freelance data analysis offers a career with strong demand and excellent earning potential. Create your MyFreelancer profile and start connecting with clients who need your analytical expertise.
Data Visualization Best Practices
The ability to transform raw data into clear, compelling visual stories is what separates a data analyst from a spreadsheet operator. Your clients hire you not just to crunch numbers but to make those numbers understandable and actionable. Strong data visualization skills multiply the impact of every analysis you deliver.
Choose the right chart type for the story you are telling. Line charts work best for showing trends over time. Bar charts excel at comparing categories. Scatter plots reveal relationships between variables. Pie charts, despite their popularity, are almost always a poor choice because humans struggle to compare the area of sliced circles accurately. A simple bar chart communicates the same proportional data far more effectively.
Simplicity is the foundation of effective visualization. Remove every element that does not contribute to the viewer understanding. Grid lines, decorative borders, three-dimensional effects, and excessive color all add visual noise without adding informational value. The best visualizations feel effortless to read because every design decision serves the data rather than decoration.
Color should communicate meaning, not just variety. Use color to highlight the most important data points, distinguish between categories, or indicate positive versus negative trends. Stick to a limited palette, typically two to four colors, and use shading variations rather than entirely different colors when you need to show gradations within a category. Consider color blindness in your design choices. Roughly eight percent of men have some form of color vision deficiency, so relying on red-green distinctions alone can make your visualizations inaccessible.
Annotation transforms a chart from a picture into a story. Adding brief text labels that call out key findings, explain unusual patterns, or highlight significant thresholds gives your audience the context they need to draw the right conclusions. Without annotation, viewers are left to interpret the data on their own, which often leads to misunderstandings or missed insights. Your MyFreelancer portfolio should showcase annotated visualizations that demonstrate this storytelling ability.
Interactive dashboards are becoming an increasingly requested deliverable. Clients want to explore their data on their own terms, filtering by date range, segment, or metric. If you can build these dashboards using tools your client already has access to, you add enormous ongoing value. Include dashboard creation as a service option in your Store and highlight it in your Billboards to attract clients who need more than static reports.
Presenting Findings to Non-Technical Clients
The moment of truth in any data analysis project is when you present your findings to the people who will act on them. These decision-makers are rarely technical. They are business owners, marketing directors, operations managers, or executives who need to understand your conclusions without wading through statistical methodology. Your ability to communicate clearly with this audience determines whether your analysis actually drives business decisions.
Start with the conclusion, not the methodology. Non-technical clients want to know what you found and what it means for their business. They do not need to understand your regression model or your data cleaning process. Lead with the headline finding, support it with two or three key pieces of evidence, and then make a clear recommendation. If they want to understand your methodology, they will ask, and you can provide that detail in a supplementary section.
Use analogies and real-world comparisons to make abstract findings concrete. Telling a client that their customer churn rate is fourteen percent may not register. Telling them that for every hundred customers they acquire, fourteen leave within a year, and that reducing churn by just three points would add a significant amount to their annual revenue makes the same finding immediately compelling and actionable.
Anticipate questions and prepare answers. Before any presentation, think about what the client will want to know. "How confident are you in this finding?" "What should we do about it?" "How much will it cost to fix?" "What happens if we do nothing?" Having clear, concise answers ready for these predictable questions demonstrates preparation and builds confidence in your analysis.
Avoid statistical jargon entirely unless your audience specifically uses it. Terms like standard deviation, p-value, confidence interval, and correlation coefficient are meaningful to analysts but confusing to most business audiences. Translate these concepts into business language. Instead of "the correlation coefficient is 0.82," say "there is a strong relationship between advertising spend and sales volume, and we can quantify exactly how much additional sales each additional advertising dollar tends to produce."
Leave time for discussion. A presentation that fills every minute with slides leaves no space for the conversations that turn analysis into action. Your clients will have questions, objections, and ideas that emerge as they process your findings. Those conversations are where the real value of your work materializes. The milestone escrow structure on MyFreelancer gives you defined delivery points where these presentation meetings can naturally occur, aligning payment with the moments of highest perceived value.
Follow up every presentation with a written summary of your findings and recommendations. Not everyone who needs to see the results will be in the room, and even those who were present will appreciate a reference document they can revisit. Include your visualizations, key findings, and action items in a format that is easy to share internally. This document extends the life of your analysis far beyond the meeting itself and keeps your professional reputation visible within the client organization.